Excel Sample Test (Conti.)
IV. Create Charts
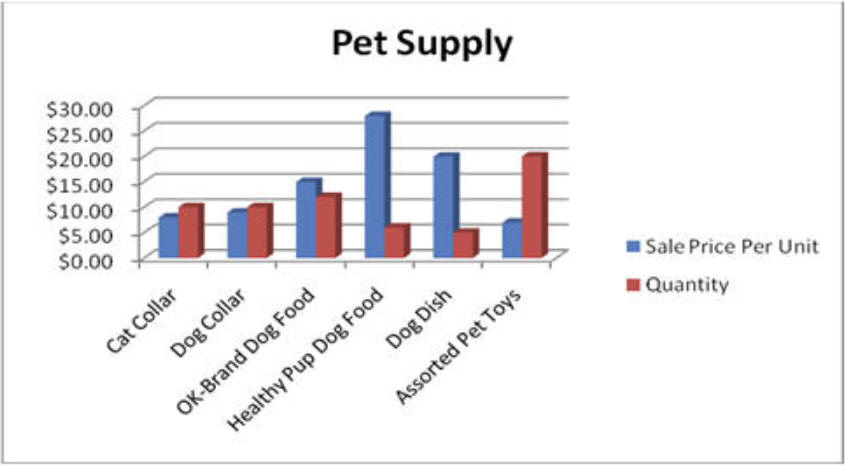
- Copy the calculations sheet to a new sheet and rename the new sheet as
Column Chart.
- Create a column chart to display the information about Sale Price Per Unit and Quantity for each item below.
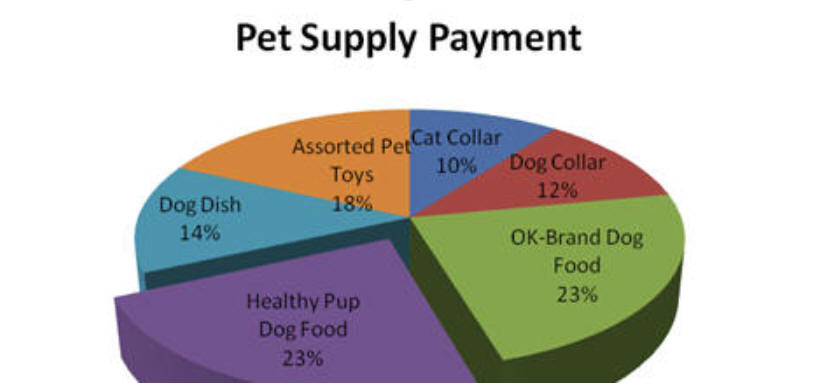
- Copy the calculations sheet to a new sheet and rename the new sheet as
Pie Chart.
- Create a pie chart to display the information about the percent of
each item final payment
against the totals of all final payments.
Save your file and submit it to Canvas.