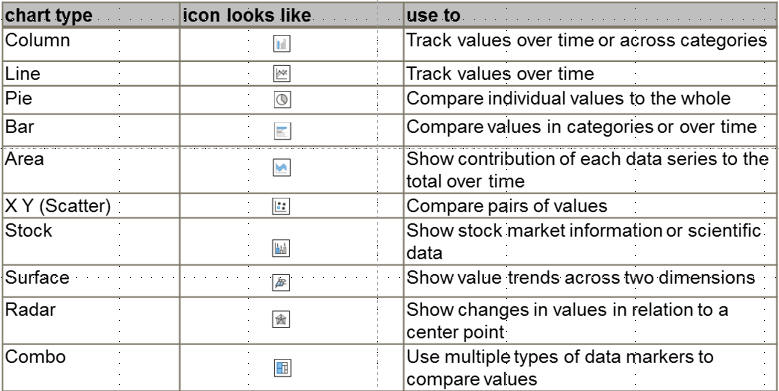
Insert a Chart
- A chart is the graphical representation of numerical data
- Every chart has a corresponding worksheet that contains the numerical data displayed by the chart
- An embedded object is one that is a part of your presentation except that an embedded
object’s data source can be opened for editing purposes
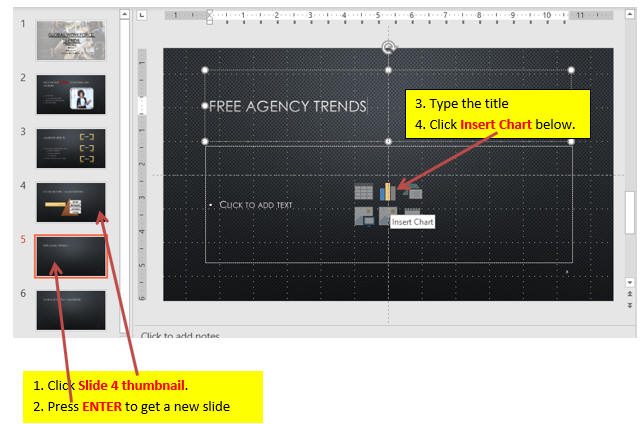
- Open PPT3 file from the last page.
- Click the Slide 4 thumbnail, then press
ENTER.
You will get a new slide with Title and Content slide layout.
- Click the Title placeholder, type Free
Agency Trends,
then click the Insert Chart icon in
the content placeholder.
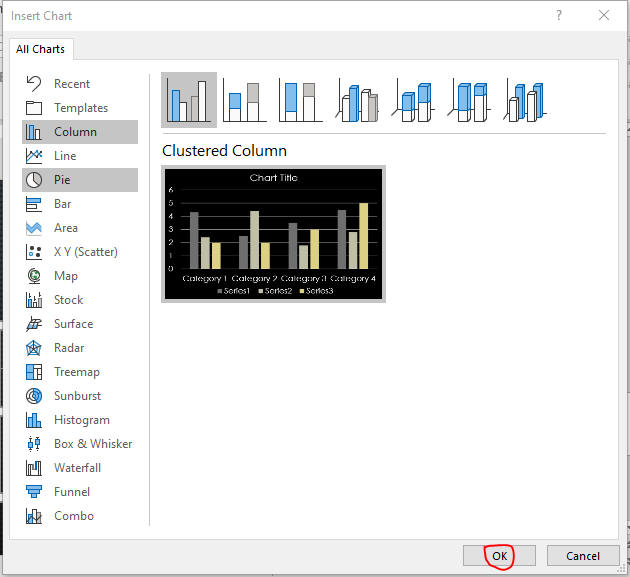
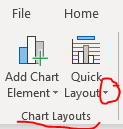
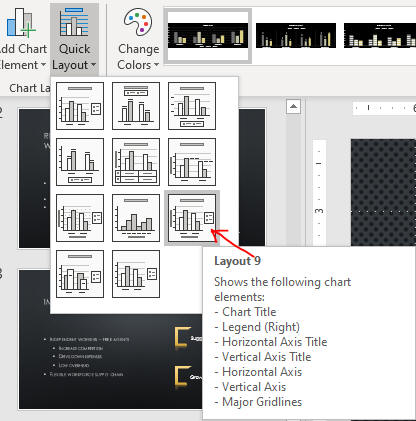
- Set Style as below and move chart up to center.
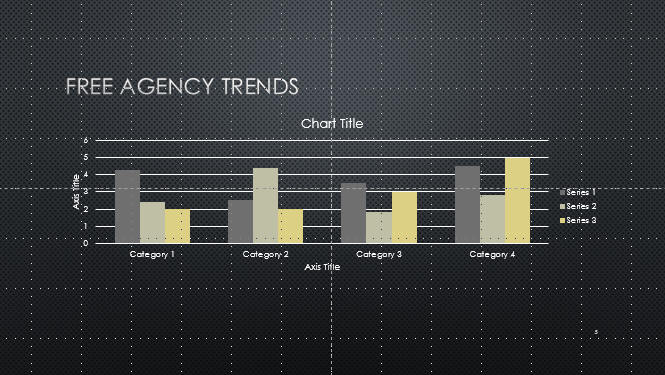
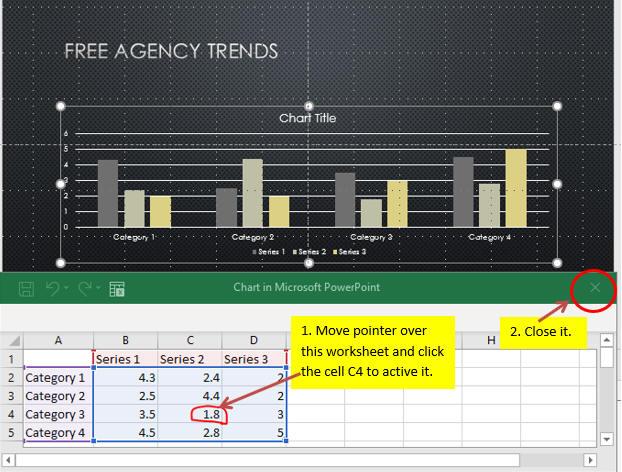
- Click in a blank area of the slide to deselect the chart.
- Save the file and go to the page, Enter and Edit Chart Data.