Enter and Edit Chart Data
- After you insert a chart into your presentation, you need to
replace the sample data with the correct information
- When you enter or import your own data, the chart is
updated automatically in PowerPoint
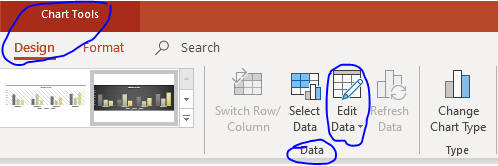
- To edit data, click the Edit Data button in the
Data group
on the CHART TOOLS DESIGN tab
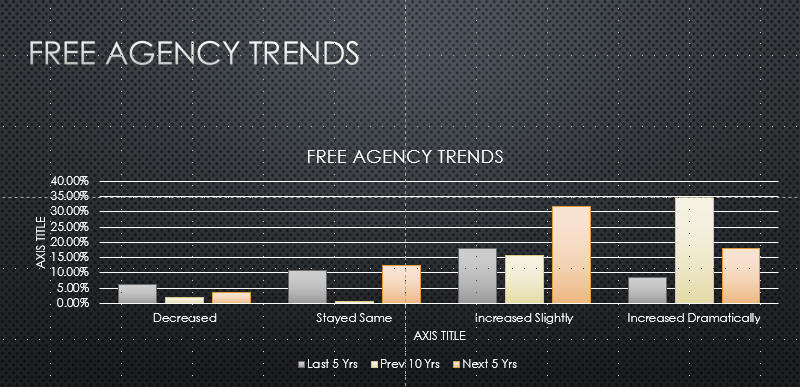
- The y-axis is also referred to as the vertical axis or
value axis,
and the x-axis is also referred to as the horizontal axis or
category axis
- Open PPT3 file from the last page.
- Click the chart object on Slide 5.
- Click Chart Tools Design tab.
- Click the Edit Data button in Data group.
- Enter data as below. Press Tab to move to right Press ENTER to
move down.
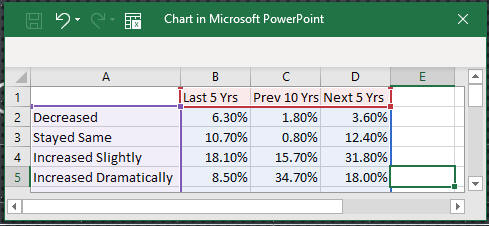 Close the spreadsheet.
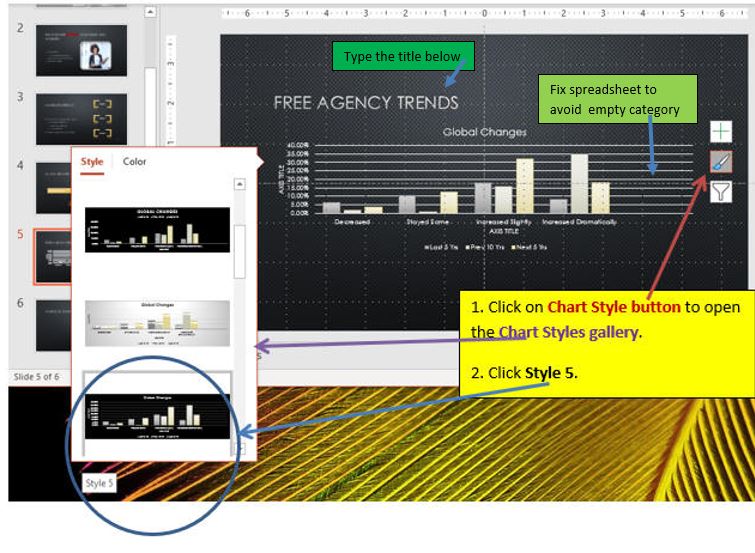
- Select Style 5 as below.
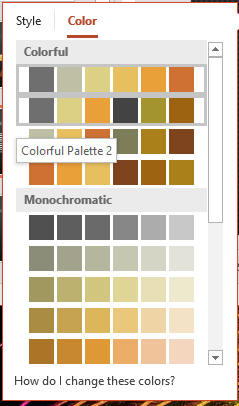
- Click Color and Click the
Colorful Palette 2 in the Colorful
section.
- Click a blank area on the slide.
- Save the file and go to Insert Slides from Other Presentations